DATA ANALYTICS
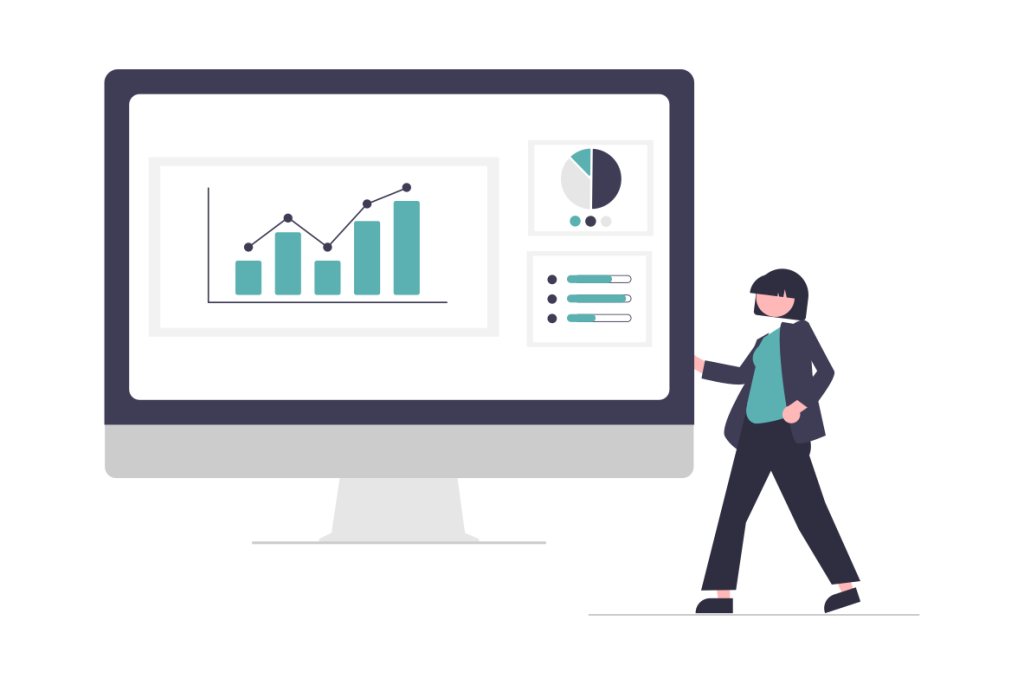
Boost your income with your Dashboard
Detect the key aspects of your business to obtain answers that will allow you to push your company to new heights
Data Management Services and Reporting
We usually have a large amount of information about our company at our fingertips but we often do not take advantage of it, often due to a lack of knowledge of its usefulness or lack of time.
For this purpose, data extraction, transformation, and loading (ETL) methods are used that allow, a simple information panel, to visualize how the company is working. In this way, pain points are detected and action plans are established to improve your company’s performance.
Why monitor my business data with Dashboards?
It cannot be said that you are in search of improvement when we often do not have defined metrics, or do not monitor them properly, to help us know if we are going in the right direction. That is why it is key to establish measurable objectives that can be easily tracked, for example, with a scorecard.
Advantages resulting from proper data control
Difficulties arising from the management of your data
Monitoring your Business Data
Tell us about the needs of your company and we will advise you on the treatment of your data so that your business continues to grow.
Hoping to hear from you soon!

Send us your needs, we will evaluate them and contact you

We will analyze your case closely, with you, and free of charge

We provide you with a free quote
FAQ Data Processing and Analysis
What is the meaning of ETL?
It is a data integration that consists of three steps: extraction, transformation, and loading of the information.
In the first step, data are acquired from the different desired sources, in the second step, modifications and/or calculations are made on these databases and, finally, the information is loaded graphically on a dashboard.
What is a scorecard?
Also called information panels or dashboards, these represent customizable reports with different graphics that show the current status of a company or department of it.
What is Big Data?
A high volume of data with a certain complexity is difficult, and sometimes impossible, to process by traditional means such as Excel.
What tools does MORHE recommend for your company’s information panels?
If you are starting out, we recommend tools such as DataStudio or PowerBi because of the functionalities they offer and their low cost. If you require more professional alternatives, you can create customized dashboards with tools such as Streamlit.