This project has been carried out with the aim of improving awareness and interaction in the social media accounts of our clients so they can increase their leads by digital means (acquiring new potential customers). The stages shown in this project are:
- Analysis of the current communication channels and the data measurements that were being taken. Here we analyzed the kind of content (organic or paid among others), the results achieved and the detection of your target customer and/or “Tribe” (Seth Godin).
- Set a strategic communication plan. What channels should we focus on? What metrics do we need to measure? Set goals (KPIs and OKRs) and the type of content required.
- Create content and manage your social media accounts in pursuit of the goals set in the previous period.
- Implementat new measurements and analyze the data obtained. How is the new content going? Carry out periodic evaluations to improve your customer’s methodology so they get better results.
- Conclusions: the improvements obtained are shown, as well as the cost of the services provided.
Initial analysis of the company’s communication channels
In the first step, we analyzed the company. Together with them, we clarified what was the target customer they were looking for. Once this first point was made clear, and with full access to the analytical data they had (up to 2020 included) we analyzed several points such as impressions, reach, type of content uploaded, interaction rate, or profile of users who followed the social networks.
After these reviews, we found the following starting point was:
- The client’s company has 4 social networks: Twitter, Instagram, Facebook, and LinkedIn. All together they have close to 2,000 followers.
- Instagram and Twitter are the most used accounts, leaving LinkedIn and Facebook in the background, reaching times when they are not even used for months.
- Its content pieces are highly oriented to the sale of products offered by the company. And it provides little value to the reader beyond the technical information of these. In addition, this is 100% organic, no advertising campaign is carried out through digital media.
- Our client wanted to focus on business-to-business (B2B) transactions, but their current followers are mostly end customers (B2C, business-to-customer), so we will have to reverse this situation.
- The trend of their social media outreach and interactions was negative in 2020 compared to 2019. This may be due to the fact that in previous years the most viewed content was related to events and because of COVID-19, this has disappeared… This drops differences among our social media client accounts. On average it is around -25%, which added to the little activity that was already there before in these communication channels, these numbers are quite worrying.
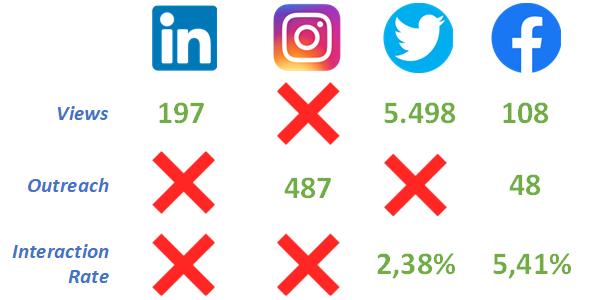
- Until now, the data was not monitored but taking the historical information that we found in the social networks we have the following data (indicated as a monthly average in 2020) that would serve as a reference to set the goals for 2021:
Based on this data, a strategic plan was developed to meet the goal set by our client, which was to increase its presence in digital media.
Digital strategy in social media
Prior to analysis of any kind, our client told us that he wanted to increase the number of potential customers in its various digital media accounts. After the relevant analysis the following strategies were established (for the first 6 months):
- It was necessary to get more information from these communication channels so we could do better in future campaigns, being more effective in our digital marketing strategies. To do this, we did periodic reports in which we analyzed how it was going and what actions we were going to take.
- Due to the fact that current followers did not relate to the final customer sought, we replanted the type of content carried out to boost the arrival of B2B followers (LinkedIn) trying to keep most of the B2C audience that we already had (Instagram). This content went from being 100% sales-oriented, as it was until then, to seek a mix of virality and valuable contribution to our B2B customers.
- It was necessary to “reactivate” their social media. To do this, and based on what was mentioned in the previous point, the strategy focuses on boosting their LinkedIn account (mostly inactive so far and with only 71 followers) and increasing the outreach and impressions on Instagram. The content created will be practically focused on these two accounts, but we will seek to increase the interaction rate on Twitter and Facebook.
- Taking into account that no paid digital campaigns will be carried out, the following KPIs are proposed for the first half of the year:
- Total followers: +15% (focusing most of them on LinkedIn and Instagram)
- Maintain an interaction rate with a +40% increase in impressions and/or reach.
- Interactions: over 6.000 (in 2020 was just under 4.000)
- To achieve these KPIs, several key objectives (OKR) are set:
- 10 pieces of content should be created per week, 70% of them for LinkedIn and Instagram.
- Initially, data analysis was made every two weeks of the accumulated data to speed up the decision-making process according to the performance of the new content. Once stabilized, a monthly review is enough.
- Share at least 2 pieces of content of interest to the B2B market in LinkedIn and Facebook groups related to our defined target customer.
After setting and agreeing with our customer, we proceeded to implement the measures set out to get the results observed in the following sections.
Implementation of solutions and measurement of these ones in our digitization plan
We are going to show you the results obtained based on basic data analytics such as impressions, outreach, or interaction rate (reports delivered to our client contained more information).
Because LinkedIn was key for the right resolution of the project, we decided to focus our efforts on it for the first few weeks and then start to distribute the workload with their Instagram account (we started in March to create content more oriented to it), which was the other main social media account we wanted to promote.
One of the measures to be taken as changing the type of content that was being shared. Most of this content was oriented to sales and sought to redirect this one to another that would provide more value to the follower. The classification of our content was set as:
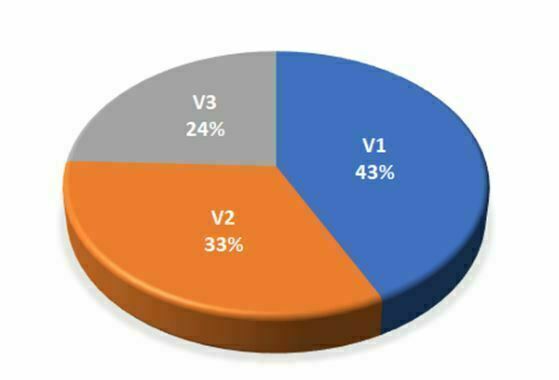
- Virality (V1) focuses on increasing the notoriety of your social media account through high rates of interaction. You can focus on what everyone is talking about in the world or in your community, making collaborations with influencers, etc..
- Value (V2) solves the reader’s problems or provides a point of view of interest to the reader.
- Sales (V3): here you just try to sell your products or services. The idea is to do it through the so-called dark posts, i.e. through paid campaigns so that it does not tarnish the image of our profile. In this project, there was no such possibility but the use of sales content was reduced considerably (initially it was more than 70%).
The following illustration shows how more than 75% of the content shared on social media has become oriented either to the content of value (V2) or virality (V1).
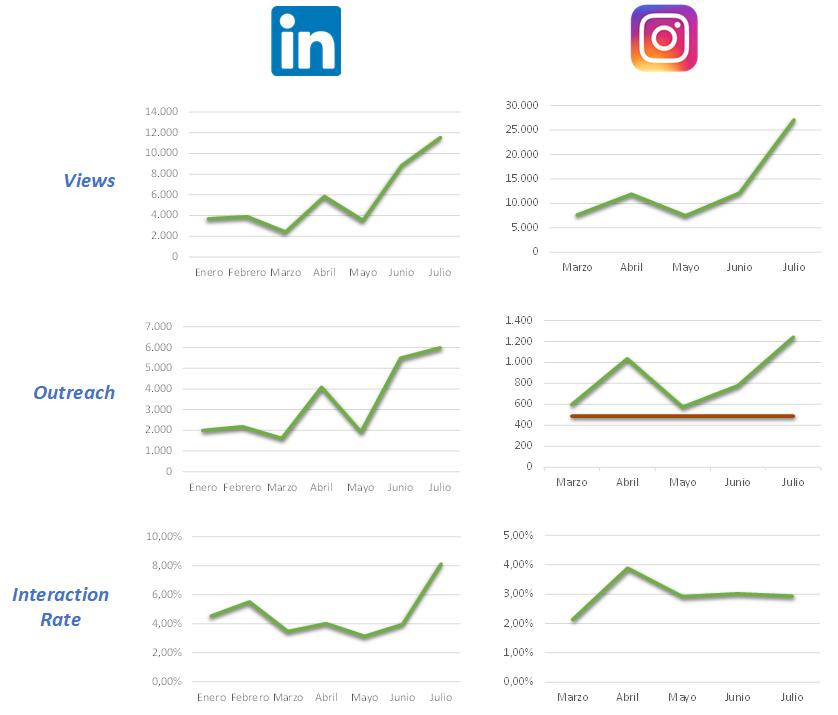
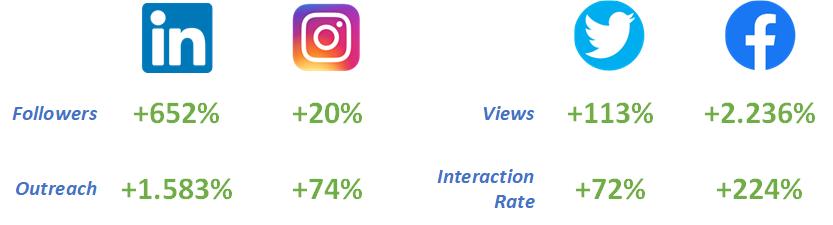
In the image shown below, the information regarding impressions, outreach, and interaction rate (%) is shown in green, while in red, if available, the monthly average for 2020 is shown.
LinkedIn and Instagram
We start with the data obtained after several months of work in the main media that we categorized as key for our client.
After all the initial changes we were already getting better results than the previous year but it wasn’t until late spring when we consolidated their follower base (this process can be accelerated by paid campaigns focused on V1 and/or V2) necessary to have the growth we were looking for to finally exceed our expectations as you will read in the conclusions section.
It is worthless that the interaction rate on LinkedIn has not only not decreased as the outreach has increased (which is the usual output in these cases) but it has increased, which confirms that the community of followers that has formed is made up of people who are really interested in what the company offers an / or talk about.
On the other hand, on Instagram, we have managed to keep this interaction above 3% even when the number of impressions increased (it depends on the volume but a rate higher than 2% is usually considered good, of course, it depends on the case).
Facebook and Twitter
Although these were cataloged as “secondary” social media channels, and the creation of content was not always so oriented to these ones, we can see how the numbers obtained exceed the starting point from which they came.
In both cases, something similar happened on Instagram in which there has been significant growth in recent months in terms of impressions and outreach, but we managed to maintain a high rate of interaction.

Final results and budget of the project
We have already been able to see the information stored during the first 6 months of work (February to July). In the month of January, we analyzed the initial state, then we established the strategy and agreed on it with our client.
As set in this strategy, the final results obtained are shown below. As a reminder, these were aimed at increasing awareness on LinkedIn and Instagram (increasing leads, i.e. potential customers) and encouraging interaction on Twitter and Facebook.
KPIs and OKRs
A comparison is made between the parameters (KPI and OKR) established at the beginning and those finally obtained 6 months later.
There are large positive differences due to, in large part, the massive growth of our customer’s LinkedIn account (from 70 to more than 500 organic followers) and Facebook, which has achieved a much greater reach than initially expected thanks to the use of groups where we shared our content.
Again, we refer to all data from the 4 social media channels. In addition, during February and March, the data analytics study was carried out every 15 days and later moved to monthly analysis.

Beyond the numbers we must highlight the difficulty that would have meant to reach them alone by the client itself, for example, hiring a person to do the job. This is because every day the platforms are more competitive and require a much higher level of specialization in each of the social platforms to get results… In many cases, it requires an expert for each communication channel as already happened and happens, when advertising was divided by radio, newspaper, television, etc..
Until not long ago it was enough to have someone to control your digital communication channels (all social networks, web, etc. were included). Now we have the distribution channel of Facebook, Instagram, Twitter, and Web, …, separately, which require greater skill to stand out in the market in each of these ones.
Project cost
In order to achieve the results shown, the following investments have been made by the client. The descriptions of the different points are as follows:
- The initial analysis includes the study discussed in the first section of this article.
- Once all the necessary data is available, a strategic plan was established according to the objectives that were set.
- The management of social media accounts consists of the programming and distribution of content according to the strategy V1 (virality), V2 (value), and V3 (sales) that has been set. In addition, this person has been responsible for making interactions on different social networks with followers and related topics or accounts. This would be the job of the community manager.
- Creation of 10 pieces of content per week, taking care of all the creative part of it for its subsequent organic distribution. This corresponds to the work of the content manager.
- Preparation of situation reports and 30-minute online meetings with the client to explain the current situation and the next steps to be taken.
- 2 days of 1.5 hours of online training were held in relation to the work of a community manager. By taking these training courses they saved this cost in July and August.
Initial analysis of social networks | ||
Set an strategic plan | ||
Social media management | ||
Content creation | ||
Data analysis and decision making | ||
Course about social media management | ||
Total |
*The prices indicated are dependent on the size of the project and the specific requests contained in the various tasks. The monthly price includes the tasks that were paid monthly, the rest were paid initially.

